CANopen DiagHand-held CANopen Diagnostic
and Testing devices |
Diagnostic functions
Features
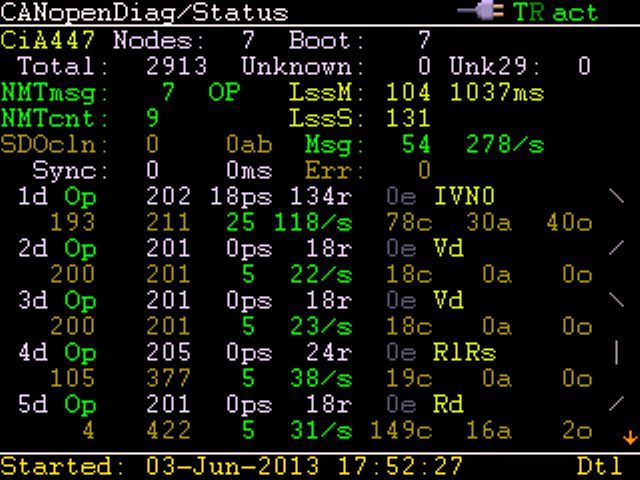
Network Status (passive)
Displays a current, overall network overview: Number of nodes found, number of boot-up messages, current bus load, longest message burst, SYNC usage, SDO usage, LSS usage.
For nodes found: NMT status, message load generated by node, node info where available (e.g. names of Virtual Devices implemented by a device) min/max heartbeat, min/max SDO response times, current message rate.
For nodes found: NMT status, message load generated by node, node info where available (e.g. names of Virtual Devices implemented by a device) min/max heartbeat, min/max SDO response times, current message rate.
Available with
Mini
Diag
Logxaminer
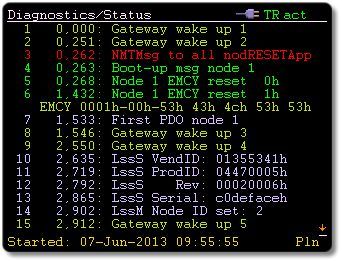
Events History (passive)
The event history shows all important network events, such as boot up times of individual nodes, first PDO usage, emergencies and node failures / restarts.
NOTE: The event history generated can be saved.
Available with
Mini
Diag
Logxaminer
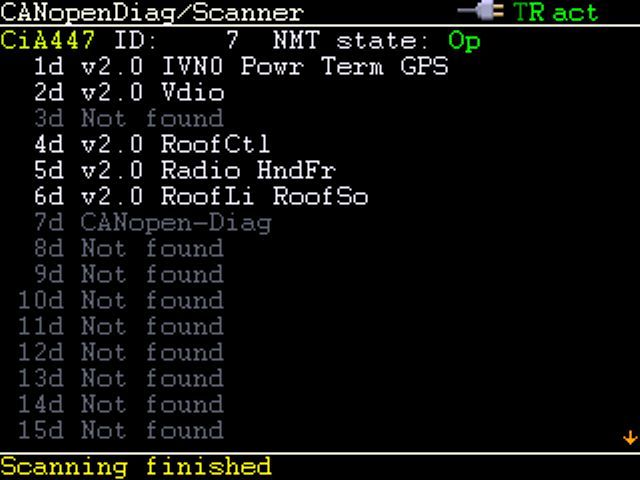
Network Scan (active)
Here, the device becomes an active node on the network and uses SDO channels to actively scan the network.
This allows building a list of currently present nodes and reading detailed information of each node.
Information displayed includes the Virtual Device Information, the regular ID Object as well as the extended ID strings (Objects 1008h to 100Ah) and the error history.
Available with
Mini
Diag
Logxaminer
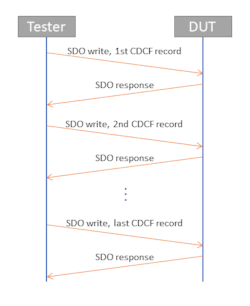
SDO Sequences (active)
This function allows sending SDO requests, as well as NMT and LSS commands.
The input is in the format of an extended Concise Device Configuration Files (CDCF) that can be generated from a .csv - allowing easy generation of the files using a spread sheet program.
Besides writing to any Object Dictionary entry, the extended commands allow reading and verifying entries (to verify if a device is the intended one).
Functionality includes assigning node IDs by Layer Setting Services (LSS) or sending a Network Management Master (NMT) message to individual nodes – for example to send a reset to a selected node.
It further allows clearing the error history as well as sending complex configurations to a node.
If a device has a CANopen boot loader, then CANopen Diag can activate the bootloader and send a file to it.
If a device has a CANopen boot loader, then CANopen Diag can activate the bootloader and send a file to it.
Available with
Mini
Diag
Logxaminer
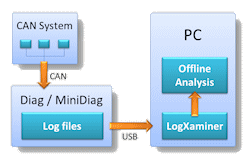
Continuous log & off-line analysis
Both Mini and Diag allow continuous background recording of all network traffic.
Configurable to automatically start with power-up of the device.
The off-line analysis is made by Logxaminer.
In continuous logging mode a trace file of all CAN message is created.
Using the included CANopen Diag manager app running on a PC, this file can be converted into a .csv file with all CANopen specific interpretations of the message contents.
Available with
Mini
Diag
Logxaminer
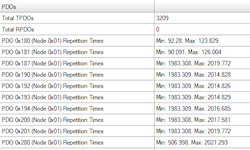
Extended message monitoring
For all repetitive messages report minimum and maximum repetition time.
In case of time triggered PDOs allows verifying the precision of the timing event.
For all SDOs (including fully meshed networks) report minimum and maximum response time.
Available with
Mini
Diag
Logxaminer
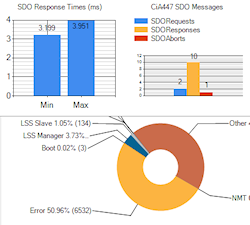
Extended graphical analysis
The extended visualization shows communication by type (how much percent of communication is used for different message types/protocols) and visualizes message rates.
Per node analysis shows message rates caused by individual nodes.
Available with
Mini
Diag
Logxaminer
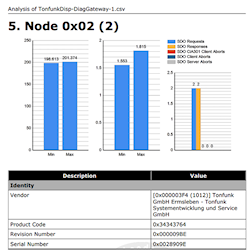
Test report
A test report can be generated in PDF format.
It includes global and per node analysis as well as an evaluation of the measured times and values.
For example, do times measured require issuing a warning or an error?
The report lists all errors found and contains all results from the extended message monitoring and the extended graphical analysis.
Available with
Mini
Diag
Logxaminer

Lines and Signals
The CANopen Diag has an included 2 channel oscilloscope which can directly monitor the two CAN low and high signals.
An external probe input can also be selected as an optional input.
Single CAN IDs or error frames can be used as trigger.
The CAN frames can be decoded and IDs, data frame and CRC visualized in hexadecimal numbers.
The voltage level on each of the 9 pins of the CAN connector can be individually monitored.
Alarms can be configured to alert the user when any of these voltage levels leave the specified window.
Available with
Mini
Diag
Logxaminer

CANopen Test Machine
The CANopen Test Machine engine allows the execution of graph based test scripts with accurate timing.
The test graphs are generated using Microsoft Visio®.
The macros required to write own tests are included.
Available with
Mini
Diag
Logxaminer
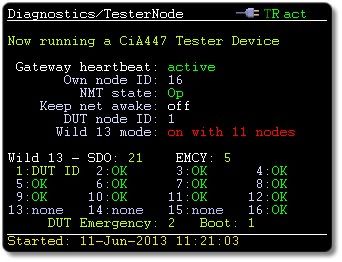
CiA 447 support
With the CiA 447 add-on, the system offers various additional functions dedicated to CiA 447. The additional SDO channels and the wake-up sleep mechanism is monitored and all traces include CiA 447 symbol interpretation.
Enchancements to Existing Functions
Enchancements to Existing Functions
- The status monitor and event history includes CiA 447 specific data and events. The monitored data includes Virtual Device information and statistics about the individual SDO clients.
- The network scanner scans for CiA 447 specific information such as the Virtual Device information.
- The CANopen Diag Manager software can interpret traces from the continuous logger with CiA 447 symbolic data representation.
Available with
Mini
Diag
Logxaminer
Copyright © 2005-2025 Embedded Systems Academy | All Rights Reserved | CANopen® is a trademark of the CAN in Automation User's Group